ocrreject_exam
Checks STIS CCD 1D spectroscopic data for cosmic ray overflagging.
Examples
In Python:
>>> import stistools
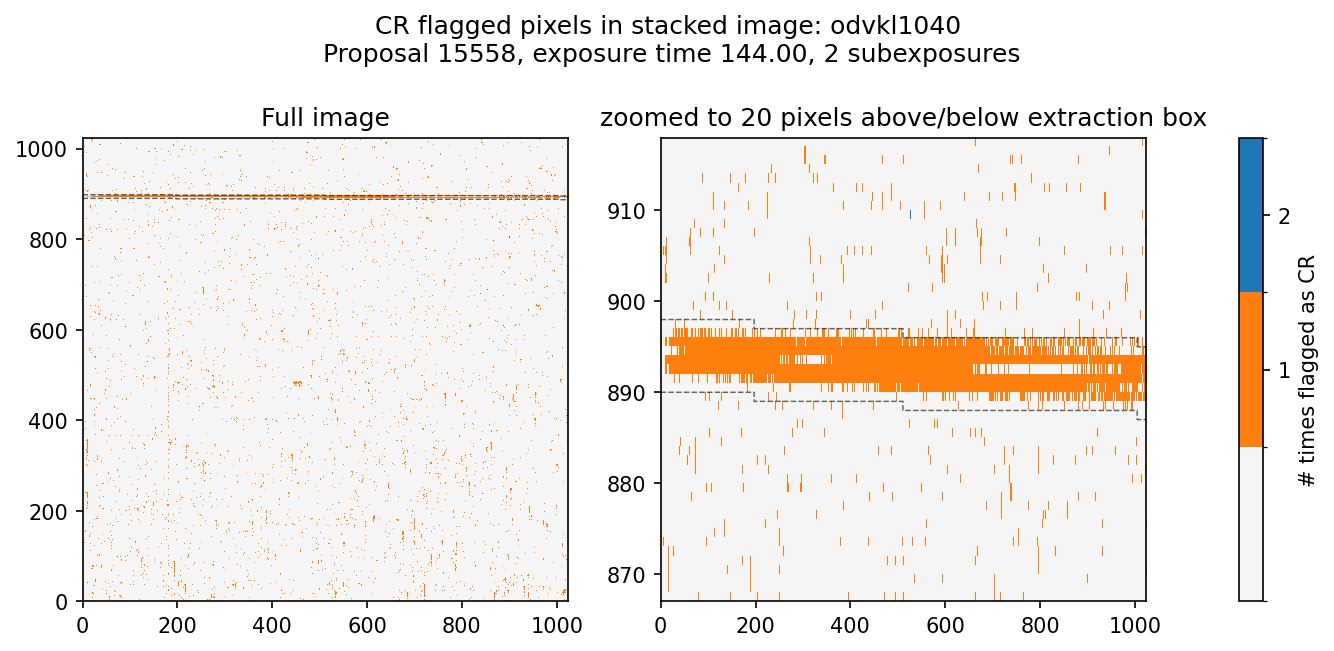
>>> stistools.ocrreject_exam.ocrreject_exam("odvkl1040", plot=True)
[{'rootname': 'odvkl1040',
'extr_fracs': array([0.31530762, 0.32006836]),
'outside_fracs': array([0.00884673, 0.00810278]),
'ratios': array([35.64113429, 39.50106762]),
'avg_extr_frac': 0.31768798828125,
'avg_outside_frac': 0.008474755474901575,
'avg_ratio': 37.486389928547126}]
From command line:
ocrreject_exam -h
usage: ocrreject_exam [-h] [-d DATA_DIR] [-p] [-o PLOT_DIR] [-i] obs_id [obs_id ...]

Calculate fractions of cosmic ray rejected pixels inside and outside of an extraction box to test for CR algorithm failures.

positional arguments:
obs_id       observation id(s) in ipppssoot format

options:
-h, --help   show this help message and exit
-d DATA_DIR  directory containing observation flt and sx1/x1d files. Defaults to current working directory.
-p           option to create diagnostic plots
-o PLOT_DIR  output directory to store diagnostic plots if plot=True. Defaults to data_dir.
-i           option to create zoomable html plots instead of static pngs. Defaults to False and requires Plotly if True

v1.0; Written by Matt Dallas, Joleen Carlberg, Sean Lockwood, STScI, December 2024.
- exception stistools.ocrreject_exam.BoxExtended(message='Extraction box extends beyond frame')
- stistools.ocrreject_exam.call_ocrreject_exam()
Command line usage of ocrreject_exam
- stistools.ocrreject_exam.ocrreject_exam(obs_ids, data_dir='.', plot=False, plot_dir=None, interactive=False, verbose=False)
Compares the rate of cosmic rays in the extraction box and everywhere else in a CCD spectroscopic image. Based on crrej_exam from STIS ISR 2019-02.
Higher ratios of cosmic ray rates in the extraction box to the rest of the image may indicate the need to rerun stistools.ocrreject() with different parameters.
- Parameters:
- obs_ids: iter of str or str
One of more STIS observation ID rootnames in ipppssoot format (e.g. odvkl1040).
- data_dir: str
Directory containing both the flat fielded (_flt.fits) and extracted spectrum (_sx1.fits or _x1d.fits) files of the observation if using obs_ids argument. Defaults to current working directory.
- plot: bool
Option to generate diagnostic plots, default=False
- plot_dir: str or None
Directory to save diagnostic plots in if plot=True. Defaults to data_dir parameter
- interactive: bool
Option to generate zoomable html plots using plotly, default=False
- verbose: bool
Option to print some results
- Returns:
- results: list of dict
rootname: obs_idextr_fracs: cosmic ray rejection rates in the extraction boxes for each CR-SPLIToutside_fracs: cosmic ray rejection rates outside the extraction boxes for each CR-SPLITratios:extr_fracs/outside_fracsavg_extr_frac: The average ofextr_fracsavg_outside_frac: The average ofoutside_fracsavg_ratio:avg_extr_frac/avg_outside_frac
- If called from the command line, prints the avg extraction, outside, and ratio values for quick verification.
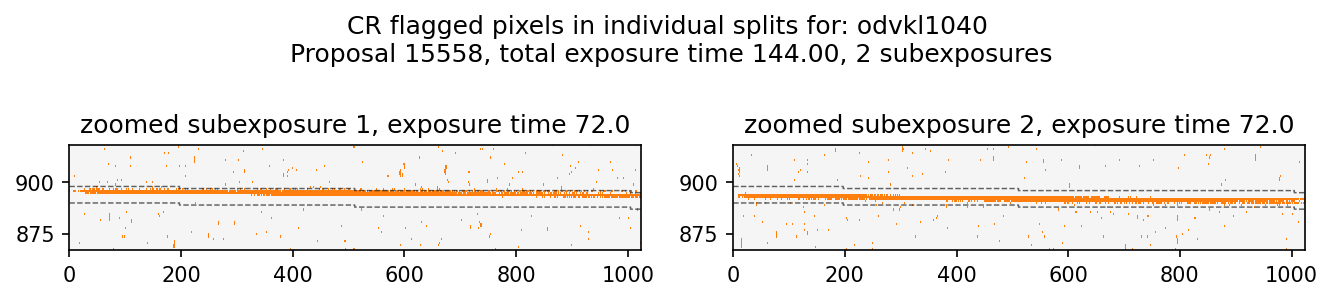
- stistools.ocrreject_exam.split_plot(splits, box_lower, box_upper, split_num, individual_exposure_times, texpt, obs_id, propid, plot_dir, interactive)
Creates a visualization of where CR pixels are in each subexposure
- Parameters:
- splits: list
list of CR flagged pixels in each subexposure
- box_lower: array
1d array of ints of the bottom of the extraction box (0 indexed)
- box_upper: array
1d array of ints of the top of the extraction box (0 indexed)
- split_num: int
Number of splits in the stack
- individual_exposure_times: list
List of exposure times for each subexposure
- texpt: float
Value of total exposure time
- obs_id: str
ipppssoot of observation
- propid: int
proposal id of observation
- plot_dir: str
Directory to save plot in
- interactive: bool
If True, uses Plotly to create an interactive zoomable html plot
- stistools.ocrreject_exam.stack_plot(stack_image, box_lower, box_upper, split_num, texpt, obs_id, propid, plot_dir, interactive)
Creates a visualization of where CR pixels are in a stacked image
- Parameters:
- stack_image: array
2d array to plot
- box_lower: array
1d array of ints of the bottom of the extraction box (0 indexed)
- box_upper: array
1d array of ints of the top of the extraction box (0 indexed)
- split_num: int
Number of splits in the stack
- texpt: float
Value of total exposure time
- obs_id: str
ipppssoot of observation
- propid: int
proposal id of observation
- plot_dir: str
Directory to save plot in
- interactive: bool
If True, uses Plotly to create an interactive zoomable html plot